
Smart City Statistics 2023 By Companies, Market Share, Prioritized Areas and Country Rank 2024
Smart City Statistics 2023 By Companies, Market Share, Prioritized Areas and Country Rank
August 22, 2024
—
Introduction
Witness the monumental development in the world propelled by cutting-edge technology, where not only the smart device industries are thriving, but also numerous cities globally are embracing smart technologies. What constitutes a smart city exactly? Which cities fall under the category of smart cities? This article on Smart City Statistics provides insights from various studies and reports that will offer you a clear understanding.
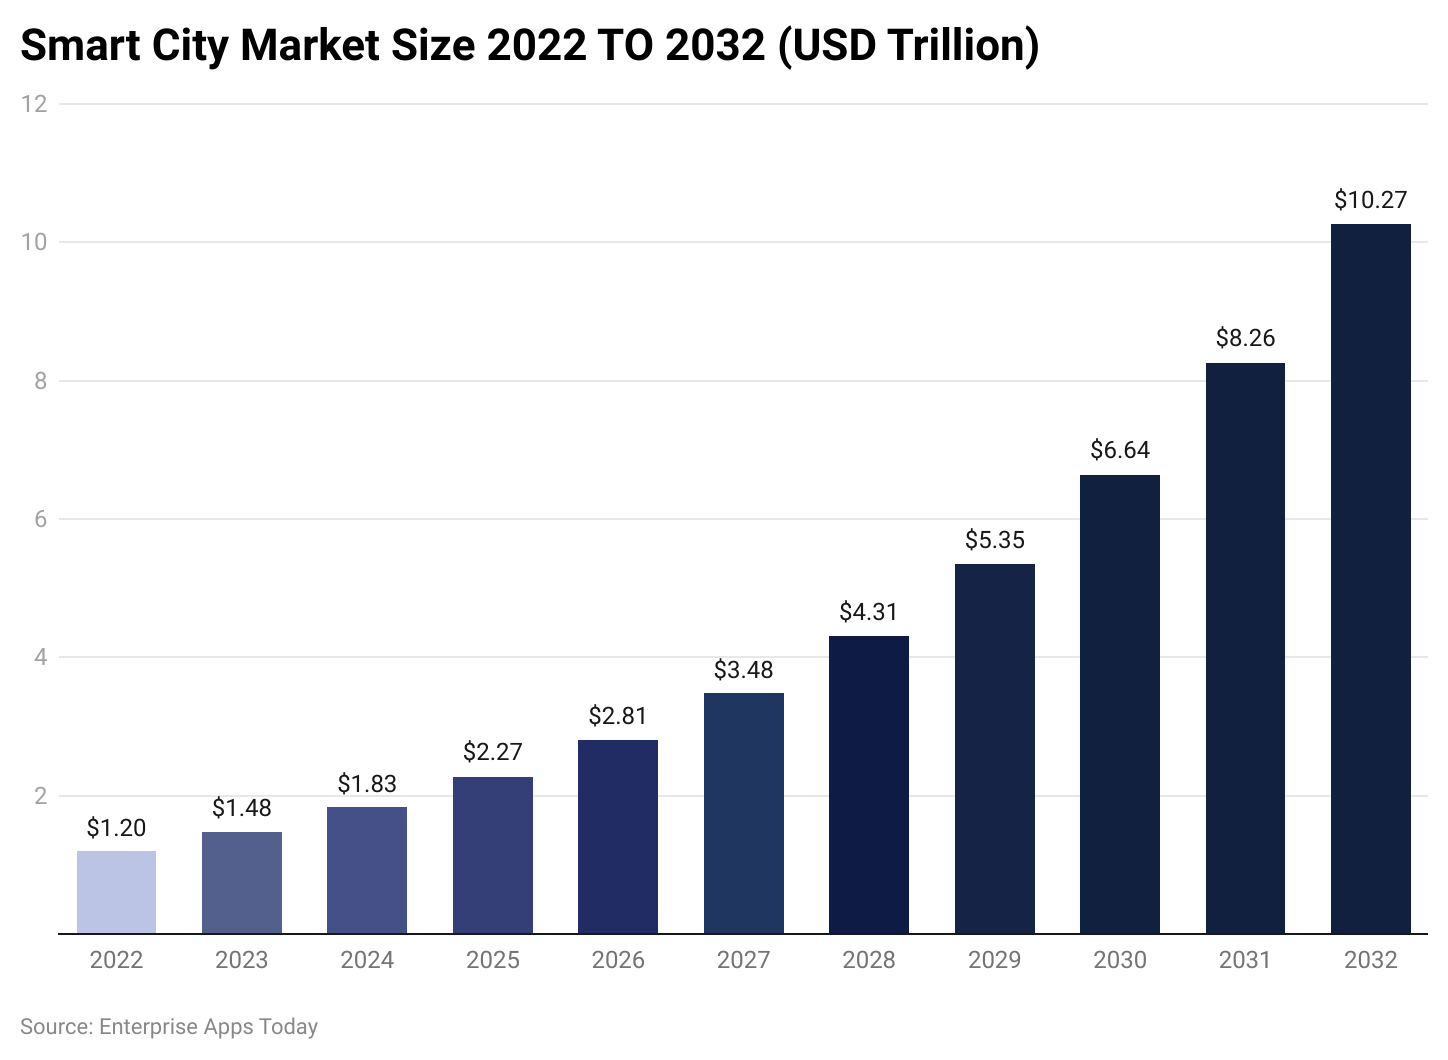
A report by Google predicts that the Smart City industry’s market size is poised to touch $10.27 trillion by the end of 2032.
Editor’s Choice
- Projections indicate that revenue from Smart Cities in the United States will hit $0.27 billion by 2023.
- The global market revenue share is expected to exceed $1.48 trillion by the end of 2023, and $10.27 trillion by 2032.
- The Compound Annual Growth Rate (CAGR) is anticipated to be 25.9% between 2023 and 2028.
- The anticipated spending on global Internet of Things in 2023 is estimated at $1.1 trillion.
- Consumer expenditure on smart home systems is predicted to reach $123 billion, while estimated technology spending on Smart city initiatives is around $124 billion.
- By 2023, 54.4% of households in the United States are expected to adopt smart home technology.
- The USA leads the global Smart Home industry with a 35% market share.
- In 2023, over 68 million smart speakers are set to be shipped within the smart home industry.
- Globally, nearly 70% of consumers aim to integrate smart home appliances by the close of 2023.
- About 45% of smart home users cite effective energy management as the primary reason for adopting smart home technology.
- By the end of 2026, the global Smart City is expected to house over 300 million smart homes.
Pros and Cons of Smart Cities Statistics
- Every innovation comes with its positives and negatives, and the same applies to smart cities.
- Advantages include reduced pollution, alleviated traffic congestion, enhanced public safety, improved energy efficiency, superior service delivery, and optimized resource consumption.
- Disadvantages encompass heightened dependence on technology, increased property values, enhanced impersonality, escalating citizen privacy concerns, and substantial investments.
Facts of Smart City Statistics
- A Smart City comprises smart home systems, smart energy systems, smart waste management solutions, smart traffic monitoring and management systems, smart healthcare facilities, efficient learning strategies, digital libraries, tech-driven community services, etc., all interconnected through IoT technologies via smart devices.
- By 2050, around 60% of the global population is projected to reside in Smart Cities, undergoing transformation through advanced technologies, modern connectivity, and upgraded infrastructure.
- 55% of American investors believe that investing in smart city technology is a judicious employment of taxpayer funds, as per Smart City Statistics.
- The fastest-growing application in smart cities is “Lighting,” with an anticipated CAGR of 24.4% by 2026’s conclusion. Automated and responsive lighting schemes play a crucial role in enhancing city intelligence.
- Europe leads in smart city initiatives, with 170 projects as of 2023.
- Currently, 66% of cities in the United States are investing in various technologies for smart city endeavors.
- China plans to develop over 500 smart cities by 2023, aligning itself with the era of advanced urban living technologies.
- By 2030, nearly two-thirds of total traffic is forecasted to be comprised of automotive vehicles, reflecting the integration of vehicles in smart cities.
- The primary focus of 50% of smart cities is anticipated to be climate change mitigation strategies by 2025.
- 93% of smart cities worldwide are still in the nascent stages of development.
(Reference: precedenceresearch.com)
- By 2024, the global revenue from Smart Cities is anticipated to reach $1.83 trillion, marking a 21% increase from the previous year. (Precedence Research)
- The projected market size in the upcoming years comprises figures for 2024 ($1.83 trillion), 2025 ($2.27 trillion), 2026 ($2.81 trillion), 2027 ($3.48 trillion), 2028 ($4.31 trillion), 2029 ($5.35 trillion), 2030 ($6.64 trillion), 2031 ($8.26 trillion), and 2032 ($10.27 trillion).
- Key players in the smart cities domain include IBM, Cisco, Siemens, Microsoft, Hitachi, Huawei, Schneider Electric, Intel, ABB, NEC, and AGT International.
- The United States market size is projected to reach $0.27 trillion by the end of 2023 and escalate to $1.85 trillion by 2032, with a starting CAGR of 24% (2023-2032).
- The Asia Pacific region is anticipated to exhibit the highest CAGR above 27.9% starting from the predicted year.
- North America retains the largest share of the total global smart cities market size, approximately 32.1%.
Smart City Statistics of India
- The ‘Smart City Mission’ was inaugurated by Indian Prime Minister Narendra Modi in 2015.
- In Indore, the National Smart Cities Mission Convention took place on September 26th and 27th, 2023.
- The total government funding for the mission amounts to Rs. 7,20,000 crore.
- Up to September 2023, a total of 7960 smart city projects worth around $171,432 crore (approximately $21 billion) have been tendered, as per a Wikipedia report.
- Cities slated for smart city development include Port Blair, Vishakapatnam, Tirupati, Kakinada, Amravati, Pasighat, Guwahati, Muzaffarpur, Bhagalpur, Biharsharif, Patna, Chandigarh, Raipur, Bilaspur, Naya Raipur, Diu Dadra & Nagar Haveli, Silvassa, New Delhi Municipal Council, Panaji, Gandhinagar, Ahmedabad, Surat, Vadodara, Rajkot, Dahod, Karnal, Faridabad, Dharamshala, Shimla, Srinagar, Jammu, Ranchi, Mangaluru, Belagavi, Shivamogga, Hubballi Dharwad, Tumakuru, Davangere, Bengaluru, Kochi, Trivandrum, Kavaratti, Bhopal, Indore, Jabalpur,
- Among the cities are Gwalior, Sagar, Satna, Ujjain, Nashik, Thane, Greater Mumbai, Amravati, Solapur, Nagpur, Kalyan-Dombivali, Aurangabad, Pune, Pimpri Chinchwad, Imphal, Shillong, and many others.
The Top Smart Cities Statistics by Companies
- Expected to reach $2.57 trillion by 2025, the smart cities market size globally is anticipated to have a CAGR of 22.9%.
- Global spending on IoT for Smart Cities is projected to hit $1.1 trillion in the coming years.
- By 2025, the anticipated CAGR for AI implementation in smart city applications is 30.6%.
- The top 10 smart city solution companies leading the way are Clarity, Enevo, Inscape Data, Intron, OpiAid, ParkWhiz, Premise Data, Quantela, Sensus, and Smart Rain.
Smart Cities Statistics by Prioritized Areas
![7KRsT of respondents who chose the priority area]()
(Reference: imd.org)
- A survey depicted the 15 indicators crucial for developing a smart city based on respondents worldwide.
- Among the priority areas chosen by respondents, 72% preferred affordable housing, followed by fulfilling employment (52%), unemployment (50%), health services (34.4%), road congestion (29.7%), air population (26.8%), green spaces (26.5%), public transport (26.4%), school education (23.5%), Basic amenities (21.6%), citizen engagement (20.8%), recycling (20.5%), social mobility (18.7%), security (16.4%), and corruption (12.4%).
Smart City Statistics by Country Rank
![6881F imd smart city index 2023 results]()
![ZazLU imd smart city index 2023 results]()
(Reference: imd.cld.bz)
- The IMD Smart City Index 2023 highlighted the smart city ranks globally.
- Leading the smart city initiative are Zurich (1st), Oslo (2nd), Canberra (3rd), Copenhagen (4th), Lausanne (5th), London (6th), Singapore (7th), Helsinki (8th), Geneva (9th), and Stockholm (10th).
- London, UK, sets itself apart with numerous 5G towers, green infrastructure, EV charging stations, and substantial investments in 6G, IoT, and AI for an advanced smart city.
- New York boasts well-established tech-infused infrastructure, including water quality meters, sensors, and the deployment of LPWAN (Low-Power Wide Area Network) technologies.
- France is home to important smart cities – Paris, Lille, Lyon, and Marseille.
- Tokyo, Japan, showcases a broad range of smart cities with advanced tech systems like energy-efficient buildings, and comprehensive traffic management using cameras and sensors aiming for an 80% reduction in greenhouse gases by 2050.
- Berlin, Germany, boasts energy-saving smart streetlights promoting sustainability and efficient transportation with plans for carbon neutrality by 2050.
- Washington focuses on establishing a sustainable urban environment and driving economic development in 2023.
- With an expected 47% of the population aged 65 and above by 2050, advanced digital healthcare systems cater to the needs of the elderly population.
Components of Smart City
![iota smart city components]()
(Source: ttgtmedia.com)
- The smart city market segments include governance and education (24.6%), smart security (13.5%), smart energy (15.8%), smart infrastructure (13.1%), smart mobility (8.7%), smart healthcare (14.6%), and smart building (9.7%).
- Smart buildings integrate advanced sensors and systems for optimization and monitoring functions like Indoor Environmental Quality monitoring for weather, temperature, noise level, airflow, and energy efficiency.
- Public safety and security measures feature predictive surveillance systems, advanced cameras, IoT sensors, and other devices.
- Effective waste management trends in smart cities leverage MetTel’s IoT connectivity and single SIM for multi-area coverage.
- Traffic streetlights primarily install low-power sensors and networks.
– CCTVs and buildings, etc.


– Smart Home Networks facilitate the secure sharing of home sensor data with neighbors, while also promoting and enhancing security services.
– Smart supply chain and logistics management is predominantly utilized by numerous companies and warehouses to track product shipments in real-time, ultimately reducing theft.
– Intelligent farming supports farmers in comprehending environmental factors through sensors that monitor nutrient levels, temperature, soil moisture, light intensity, and humidity.
Future Statistics of Smart City
-
– The projected AI market share in smart cities is set to reach $326 billion by 2028.
– Top 50 cities are expected to invest over $330 billion in implementing smart city technologies by 2025.
– By the end of 2025, the smart city market size in the Asian Pacific region is anticipated to lead with revenues estimated at $320 billion.
– According to Zipdo reports, the infrastructure and construction sector within smart cities is forecasted to reach $57.05 billion by 2027.
– The communication segment of smart cities is predicted to attain a market size of $377 billion by 2025.
– Canada’s smart city growth rate is expected to reach a CAGR of 19.2% by 2024.
– The Chinese smart city technology market is anticipated to exceed $38 billion by the end of 2023.
– Developing nations are projected to account for 20% of the global smart cities market share by 2025.
Global Smart Home Statistics

(Source: Market.us)
Global Smart Manufacturing Statistics

(Reference: statista.com)
Statista predicts that the smart manufacturing market size will reach $480 billion by 2023, with a CAGR of 12.3% from 2023 to 2027.
Global Smart Government Statistics

(Source: researchandmarkets.com)
Research and Markets reports that the global smart government market is expected to reach $33.69 billion in 2023 and is forecasted to reach $66.99 billion by the end of 2027, with a CAGR of 18.7%.
Global Smart Transportation Statistics

(Source: researchandmarkets.com)
The global smart transportation market is predicted to reach $143.54 billion by 2023 and is projected to amount to $261.1 billion by 2027, with a CAGR of 16.1%.
Global Smart Agriculture Statistics

(Source: researchandmarkets.com)
The global smart agriculture market is projected to reach $14.69 billion by 2023 and is expected to hit $22.83 billion by 2027, with a CAGR of 11.7%.
Conclusion
Upon completion of this article on Smart City Statistics, it is evident that this concept has enhanced infrastructure integration with advanced technologies, leading to improved connectivity, manufacturing processes, efficient transportation, waste management systems, modern governance, and surveillance. The comprehensive statistics provided in this article offer valuable insights into the subject matter.
[3px] border-t-[3px] p-4 border-[#1d598f] my-4″ style=”box-shadow: 0 0 14px rgb(9 38 66 / 8%);”>
Sources
Who discovered the smart city?
In 2007, the smart city was first coined by IBM and Cisco to emphasize the roles of technology in making cost-effective, efficient, and sustainable cities.
When was the first smart city made?
In the year 1994, it is said that Amsterdam is termed as the first virtual digital city to be created.
What are the pillars of smart cities?
Important pillars of smart cities are telecommunications, technology and innovation, transportation and mobility, finance, investment and economic development, government leadership and public policy, energy, etc.
Which is the no.1 smart city in India?
As of 25th August 2023 reports, Indore has secured the record of top smart city in India and has received the National Smart City Award.
When can a city be called a smart city?
A city that includes advanced implementation of new technologies and urban development’s such as reduced CO2 emission, improved energy efficiency, and increased citizens’ well-being.
Smart City Statistics 2023 By Companies, Market Share, Prioritized Areas and Country Rank
Data is from 2023 and 2024 and forecast data is for 2025 and 2026. We also expand the forecast data to 2027 and 2028.
——
REFERENCES:
This information was taken from various sources around the world, including these countries:
Australia, Canada, USA, UK, UAE, India, Pakistan, Philippines, Indonesia, Nigeria, Tanzania, Kenya, US, United Kingdom, United States of America, Malaysia, U.S., South Africa, New Zealand, Turkey, United Arab Emirates.
Afghanistan, Albania, Algeria, American Samoa, Andorra, Angola, Anguilla, Antarctica, Antigua and Barbuda, Argentina, Armenia, Aruba, Australia, Austria, Azerbaijan.
Bahamas, Bahrain, Bangladesh, Barbados, Belarus, Belgium, Belize, Benin, Bermuda, Bhutan, Bolivia, Bosnia and Herzegovina, Botswana, Bouvet Island, Brazil, British Indian Ocean Territory, Brunei Darussalam, Bulgaria, Burkina Faso, Burundi.
Cambodia, Cameroon, Canada, Cape Verde, Cayman Islands, Central African Republic, Chad, Chile, China, Christmas Island, Cocos (Keeling Islands), Colombia, Comoros, Congo, Cook Islands, Costa Rica, Cote D’Ivoire (Ivory Coast), Croatia (Hrvatska), Cuba, Cyprus, Czech Republic.
Denmark, Djibouti, Dominica, Dominican Republic, East Timor, Ecuador, Egypt, El Salvador, Equatorial Guinea, Eritrea, Estonia, Ethiopia, Falkland Islands (Malvinas), Faroe Islands, Fiji, Finland, France, Metropolitan, French Guiana, French Polynesia, French Southern Territories.
Gabon, Gambia, Georgia, Germany, Ghana, Gibraltar, Greece, Greenland, Grenada, Guadeloupe, Guam, Guatemala, Guinea, Guinea-Bissau, Guyana, Haiti, Heard and McDonald Islands, Honduras, Hong Kong, Hungary, Iceland, India, Indonesia, Iran, Iraq, Ireland, Israel, Italy.
Jamaica, Japan, Jordan, Kazakhstan, Kenya, Kiribati, North Korea, South Korea, Kuwait, Kyrgyzstan, Laos, Latvia, Lebanon, Lesotho, Liberia, Libya, Liechtenstein, Lithuania, Luxembourg.
Macau, Macedonia, Madagascar, Malawi, Malaysia, Maldives, Mali, Malta, Marshall Islands, Martinique, Mauritania, Mauritius, Mayotte, Mexico, Micronesia, Moldova, Monaco, Mongolia, Montserrat, Morocco, Mozambique, Myanmar.
Namibia, Nauru, Nepal, Netherlands, Netherlands Antilles, New Caledonia, New Zealand (NZ), Nicaragua, Niger, Nigeria, Niue, Norfolk Island, Northern Mariana Islands, Norway.
Oman, Pakistan, Palau, Panama, Papua New Guinea, Paraguay, Peru, Philippines, Pitcairn, Poland, Portugal, Puerto Rico, Qatar, Reunion, Romania, Russia, Rwanda, Saint Kitts and Nevis, Saint Lucia, Saint Vincent and The Grenadines, Samoa, San Marino, Sao Tome and Principe.
Saudi Arabia, Senegal, Serbia, Seychelles, Sierra Leone, Singapore, Slovakia, Slovenia, Solomon Islands, Somalia, South Africa, South Georgia and South Sandwich Islands, Spain, Sri Lanka, St. Helena, St. Pierre and Miquelon, Sudan, Suriname, Svalbard and Jan Mayen Islands, Swaziland, Sweden, Switzerland, Syria.
Taiwan, Tajikistan, Tanzania, Thailand, Togo, Tokelau, Tonga, Trinidad and Tobago, Tunisia, Turkey, Turkmenistan, Turks and Caicos Islands, Tuvalu, Uganda, Ukraine, United Arab Emirates (UAE), UK (United Kingdom), USA (United States of America, U.S.), US Minor Outlying Islands.
Uruguay, Uzbekistan, Vanuatu, Vatican City State (Holy See), Venezuela, Vietnam, Virgin Islands (British), Virgin Islands (US), Wallis and Futuna Islands, Western Sahara, Yemen, Yugoslavia, Zaire, Zambia, Zimbabwe.
Smart City Statistics 2023 By Companies, Market Share, Prioritized Areas and Country Rank
August 22, 2024
Images are for reference only.Images and contents gathered automatic from google or 3rd party sources.All rights on the images and contents are with their original owners.
Comments are closed.